Your user acquisition (UA) is only as good as your marketing analytics.
Effective user acquisition is a complex interplay between operations, creative, strategy, and marketing analytics. In this article we’ll delve deep into the analytics and marketing intelligence layer of the Mobile Game UA Playbook.
Strategy sets your UA targets. Marketing analytics tell whether you’re actually hitting them.
Mobile UA measurement begins with attribution data. In the modern mobile marketing ecosystem, attribution data is a critical but incomplete dataset. App Tracking Transparency (ATT) obfuscates user behavior, SKAN provides imprecise cohort measurement. Revenue takes weeks to mature, and your data is scattered across systems that rarely agree. Making sense of incomplete data is the difference between profitable scale and wasted spend.
An ideal marketing intelligence system turns fragmented data into decisions your team can trust.
Mobile Game UA Marketing Analytics Requirements
A complete marketing analytics toolkit does at least five things:
- Unifies and enriches your marketing data
- Reports performance at every useful level of detail
- Forecasts cohorts before the data fully matures
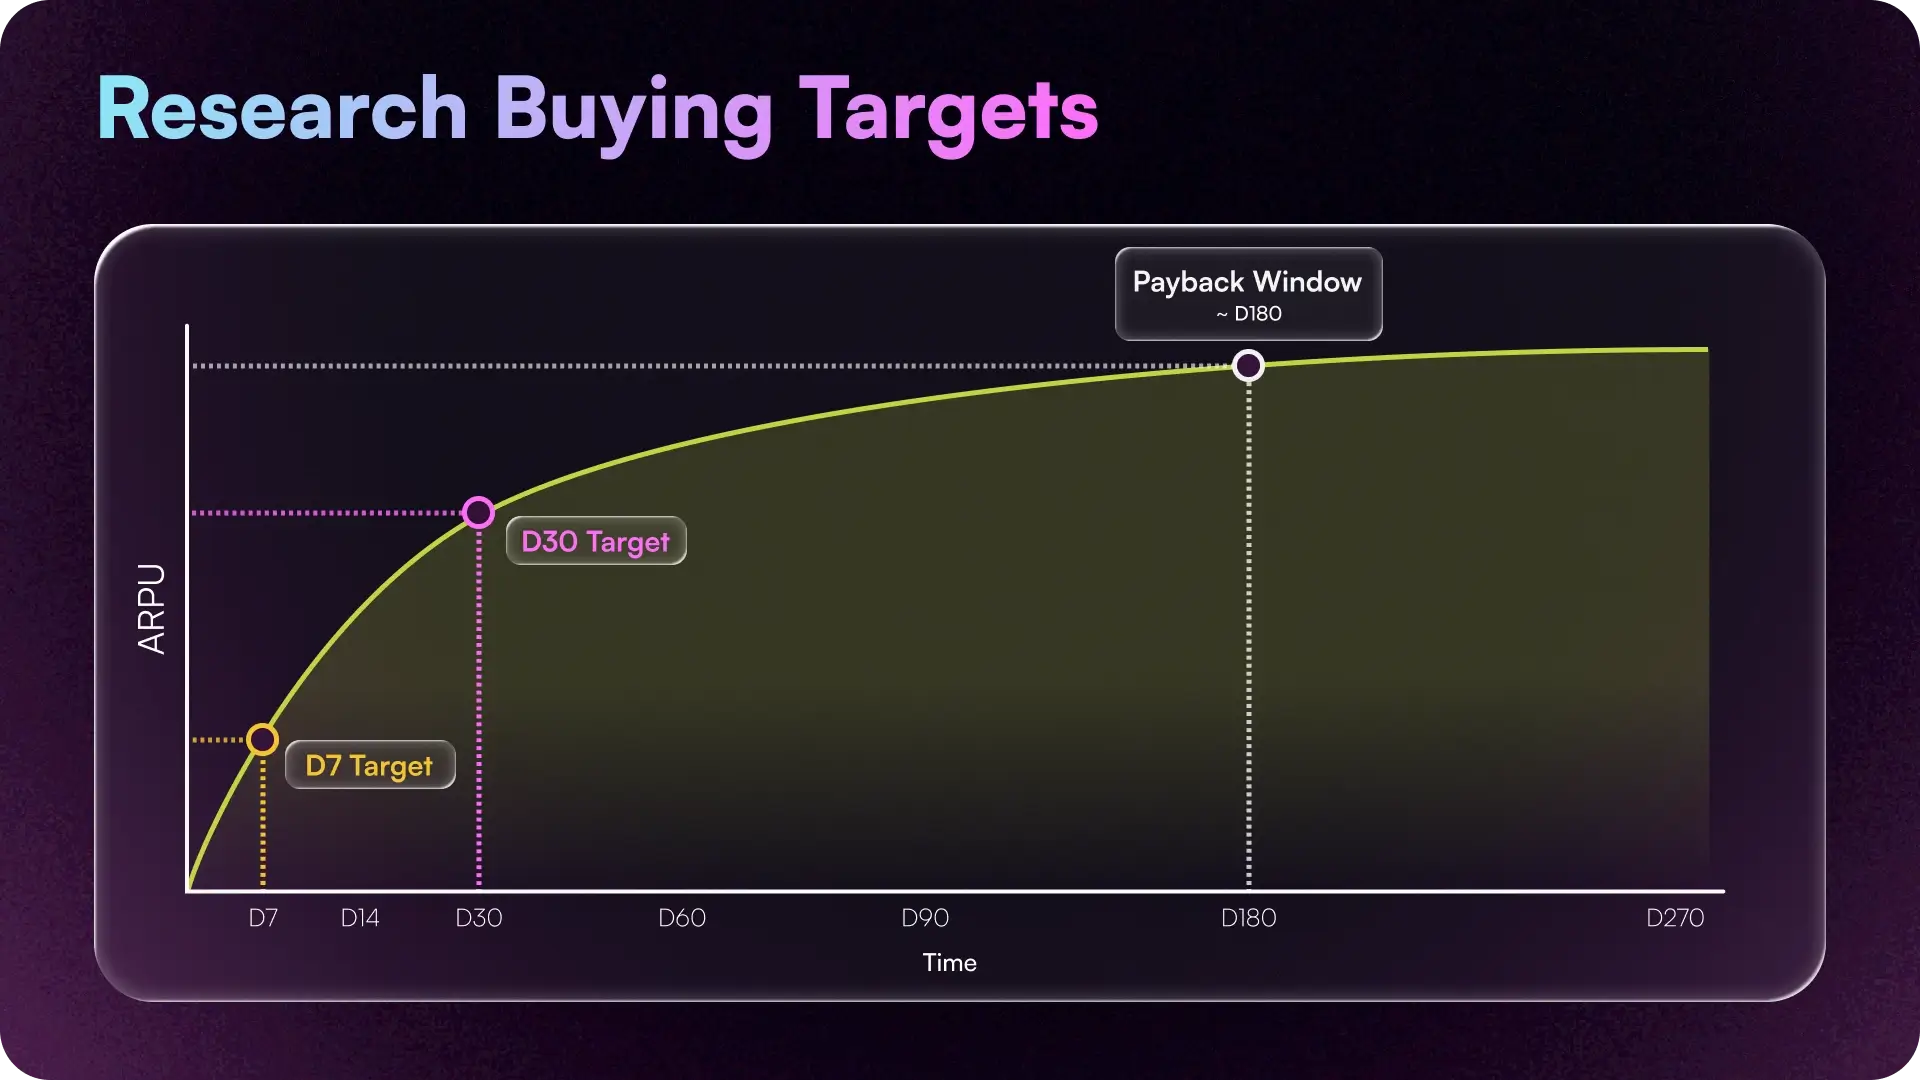
- Turns cohort analysis into buying targets
- Tracks spend and budget pacing
Unify Your Marketing Analytics Data
Your performance data lives in at least five places. Usually none of them reconcile cleanly.
- Mobile Measurement Partners (MMPs). AppsFlyer, Adjust, and Singular are the standard for gaming. An MMP sits between your ad networks and your app, deduplicates installs, and attributes them to the right campaign, channel, and ad. It’s the source of truth for post-install performance.
- Ad network dashboards. Self-reported cost and top-of-funnel metrics straight from the advertising platforms. Useful for operational tuning, never sufficient on their own.
- App Store Connect and Play Console. Store-page conversion data your MMP can’t see: impressions, product page views, and the true deliverable revenue your game is delivering.
- Creative performance data. Signal at the concept and asset level: what’s winning or losing inside the ads. MMPs stop at the ad. Connecting creative back to user outcomes is the gap most teams haven’t closed.
- Custom and internal sources. Business Intelligence warehouses, internal event streams, or arbitrary datasets your team needs joined into the picture.
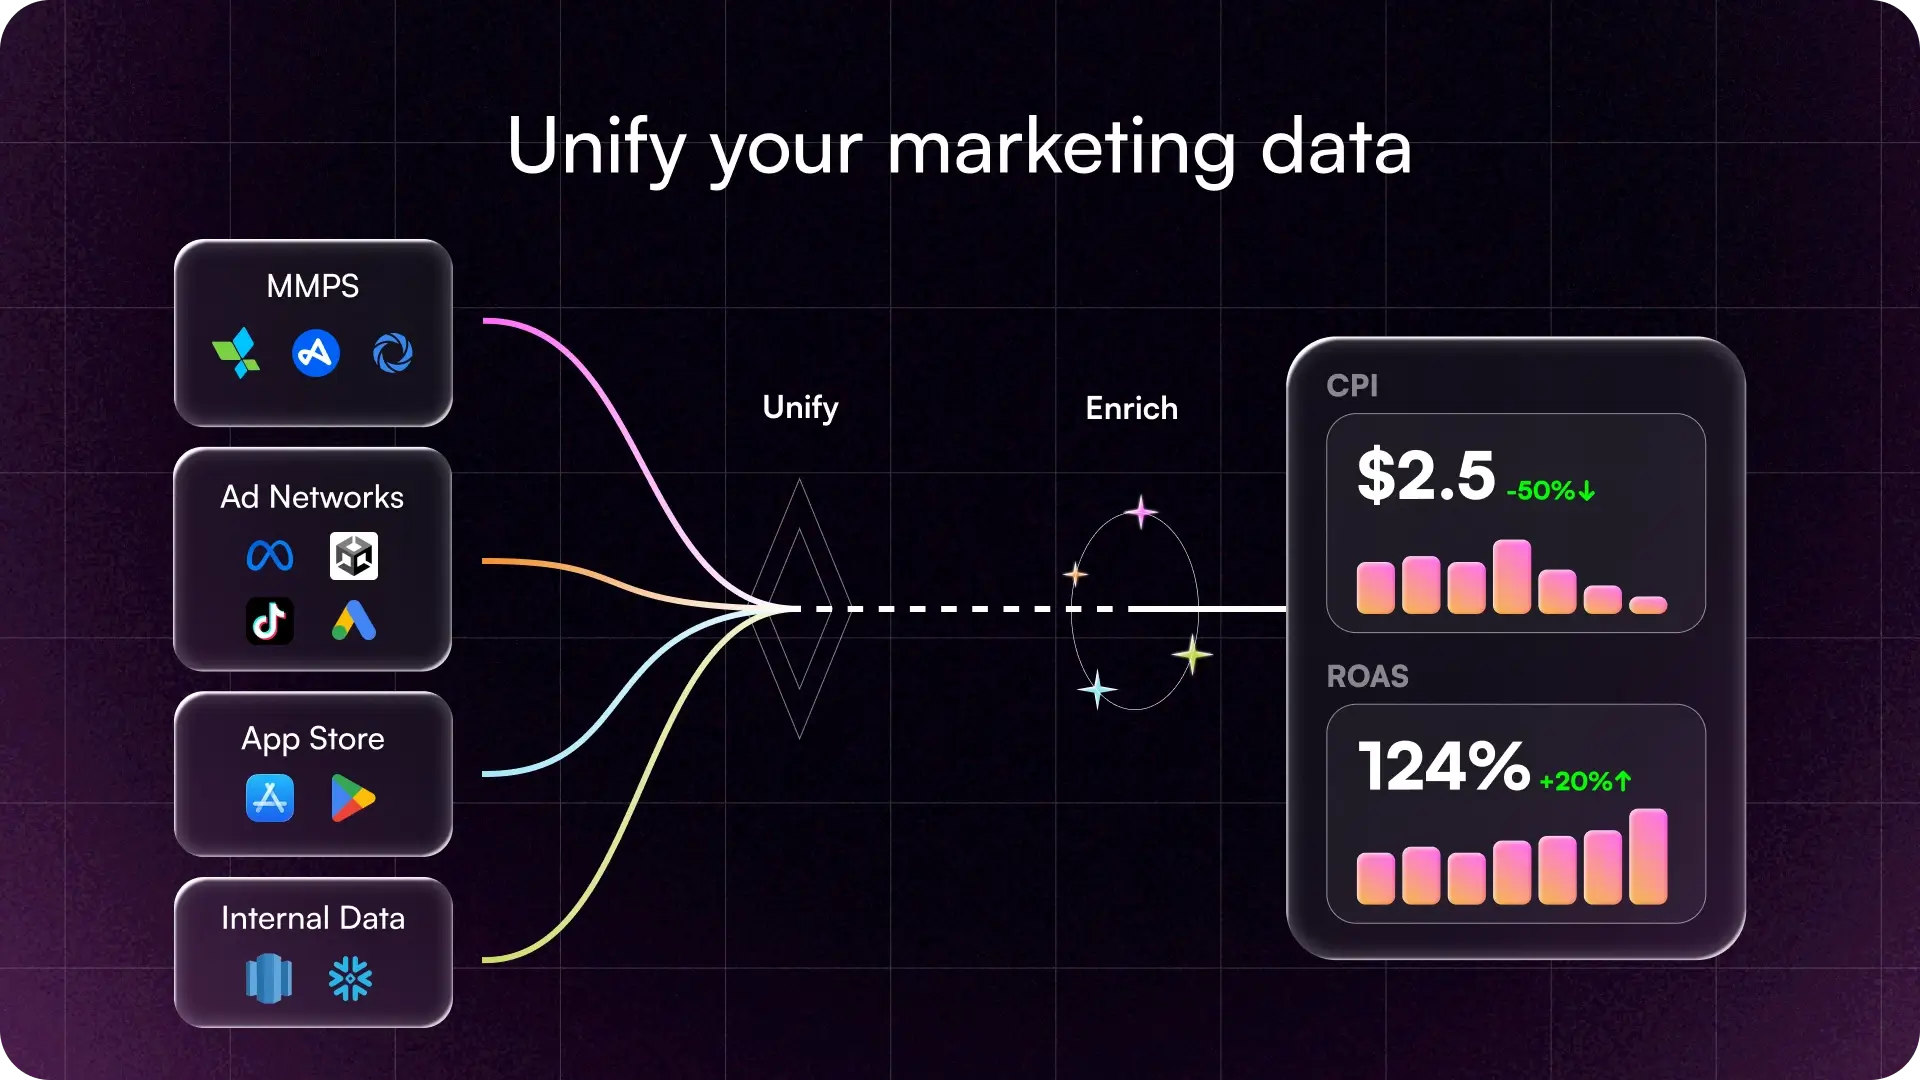
The value appears when those sources reconcile into one dataset your team can trust.
Transform Raw Marketing Data into Marketing Intelligence
Building a marketing analytics foundation is a complex job: ingest every source, normalize it, and deliver one dataset your team can trust. Pipelines refresh several times a day, network APIs change without warning, and one broken connector can derail a week of decisions.
Tools like the Upptic Game Growth Engine handle both the build and the upkeep. SDK-less integrations pull from every major source, refreshing the dataset continuously while keeping the pipeline maintained.
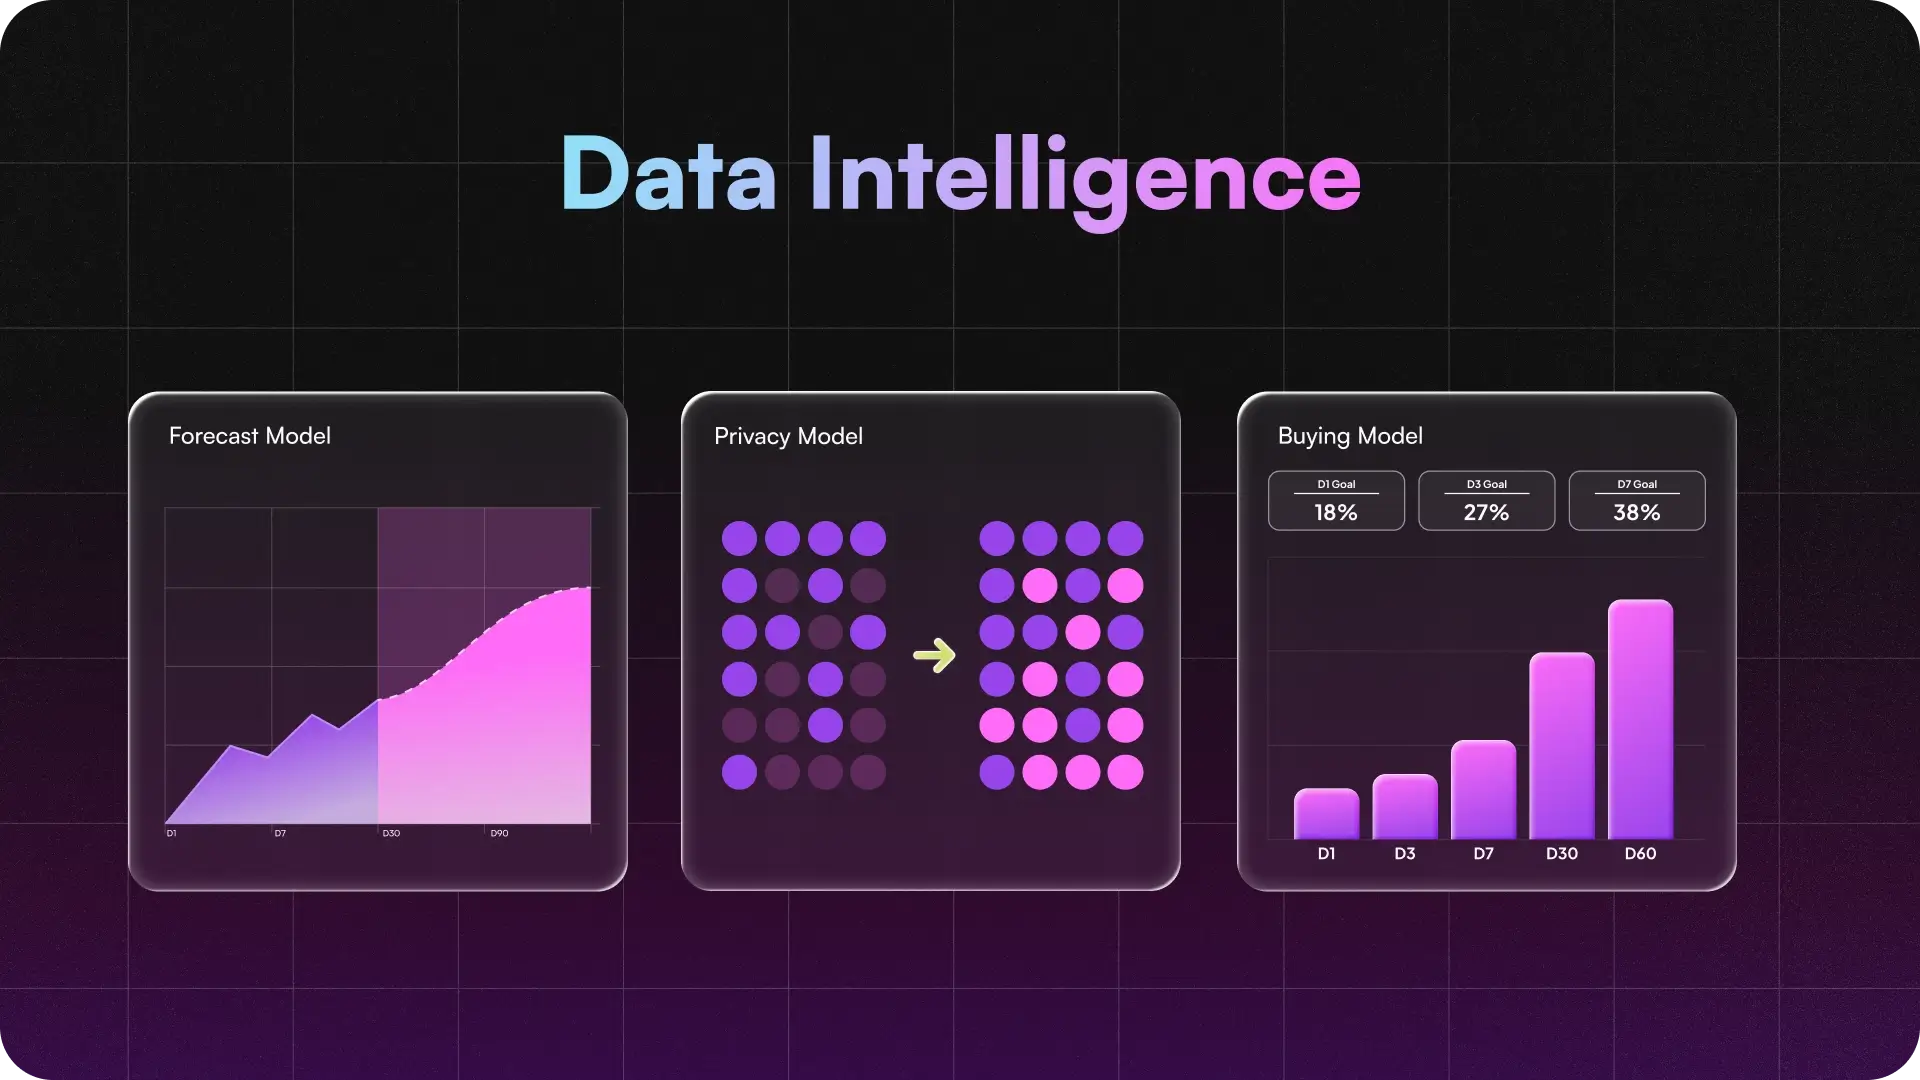
The data enrichment layer will vary by business, but for mobile UA it needs to answer three questions:
- Where is performance headed before the cohort fully matures? (Forecast Model)
- How do I measure iOS performance with incomplete attribution? (Privacy Model)
- What payback window defines our buying targets? (Buying Model)
Forecast modeling turns immature cohort data into a directional read on future performance. Privacy modeling reconciles limited iOS attribution with opted-in MMP data. Buying models translate payback windows into targets UA teams can act on.
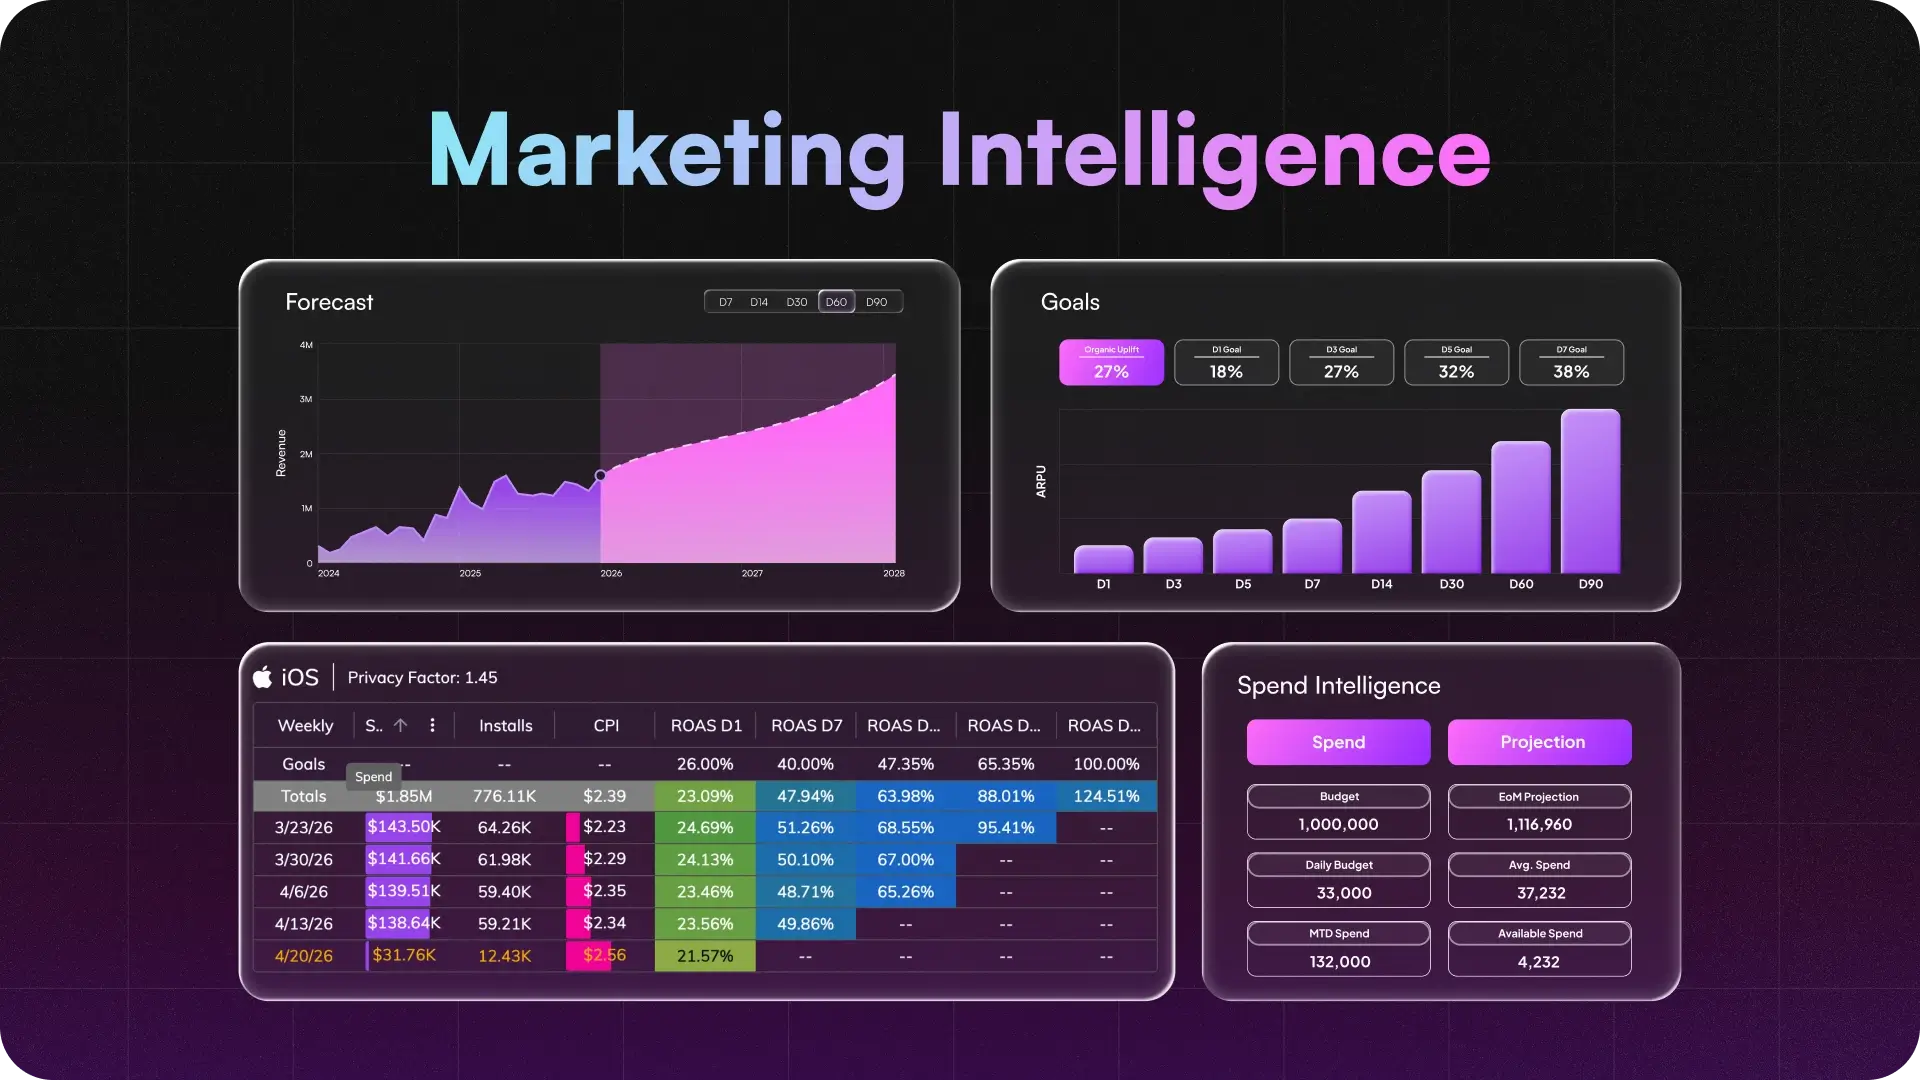
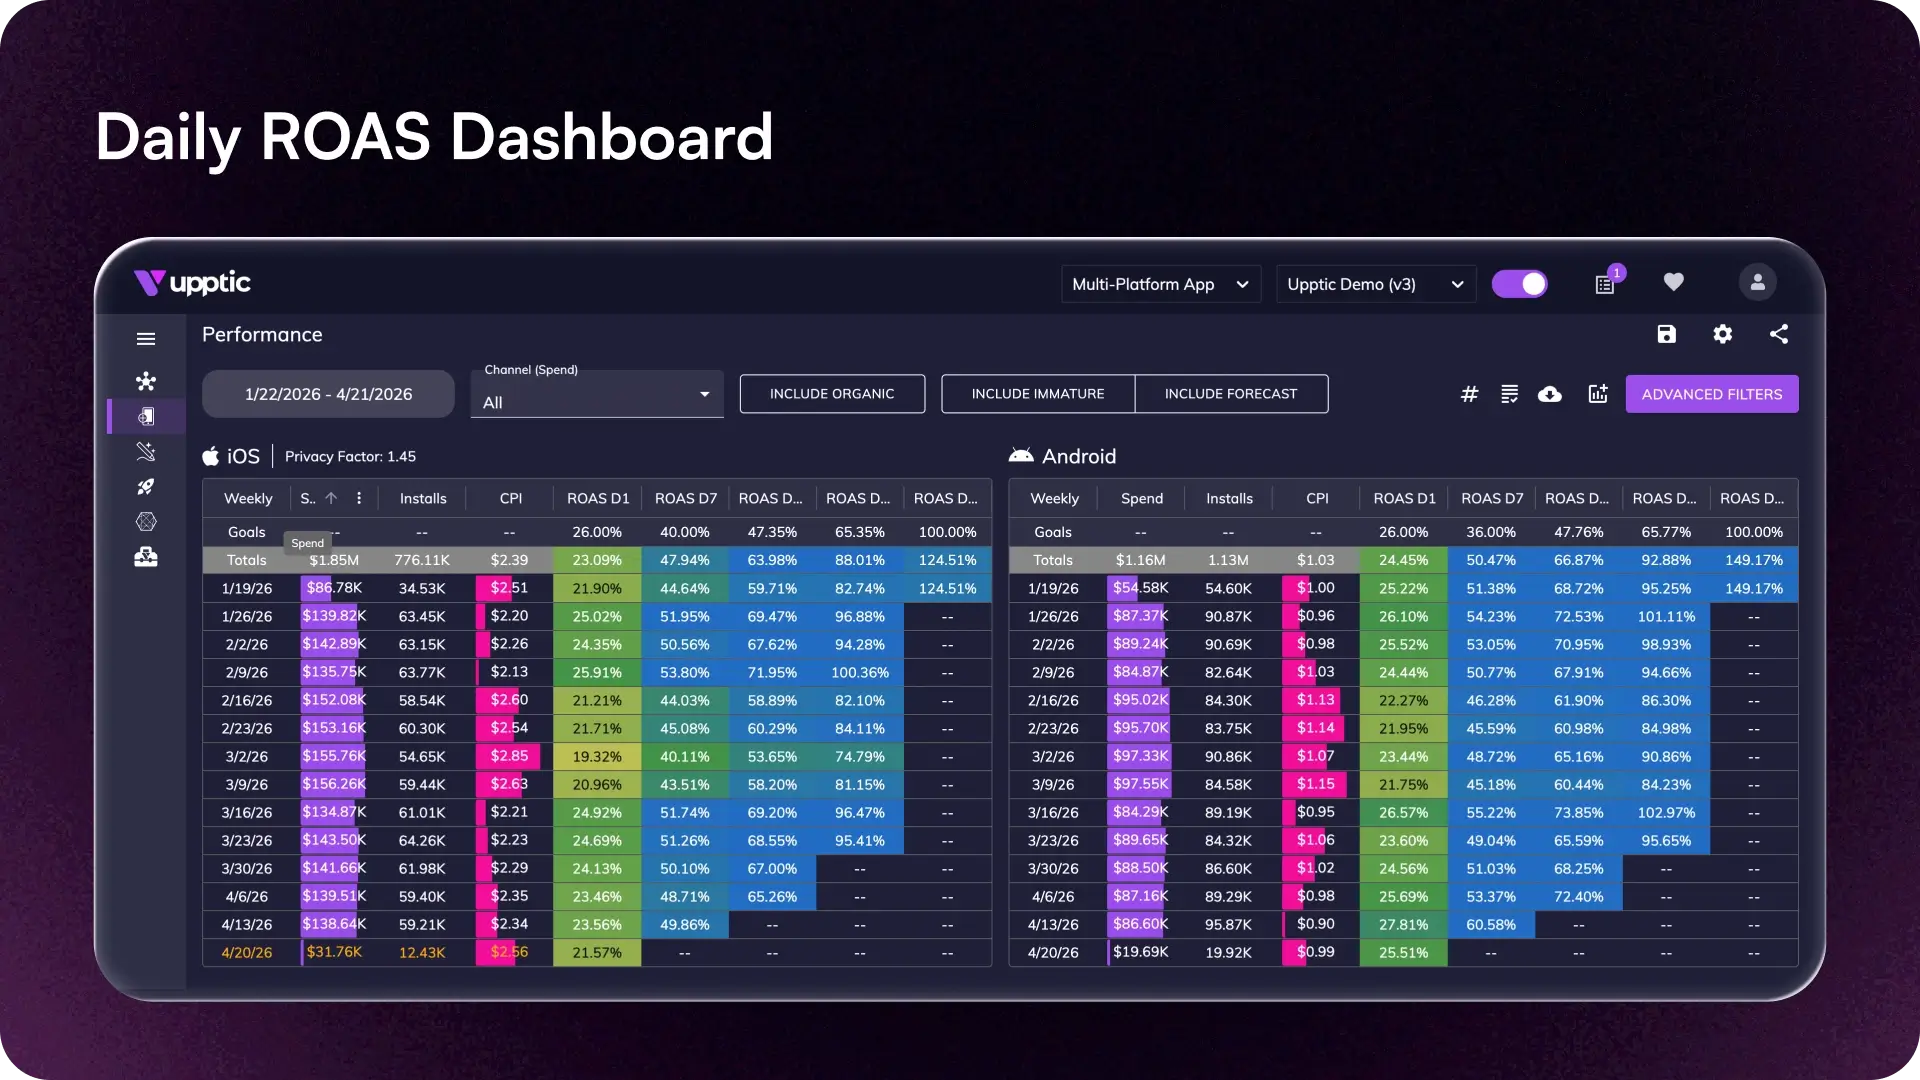
What Should a Mobile UA Performance Dashboard Track?
An effective UA dashboard answers specific questions for each team:
- Finance: Is our spending aligned with revenue, forecast, and payback expectations?
- UA managers: Which cohorts, channels, campaigns, and ads are working, and what needs to be fixed?
- Creative teams: Which creative concepts and assets are driving profitable users?
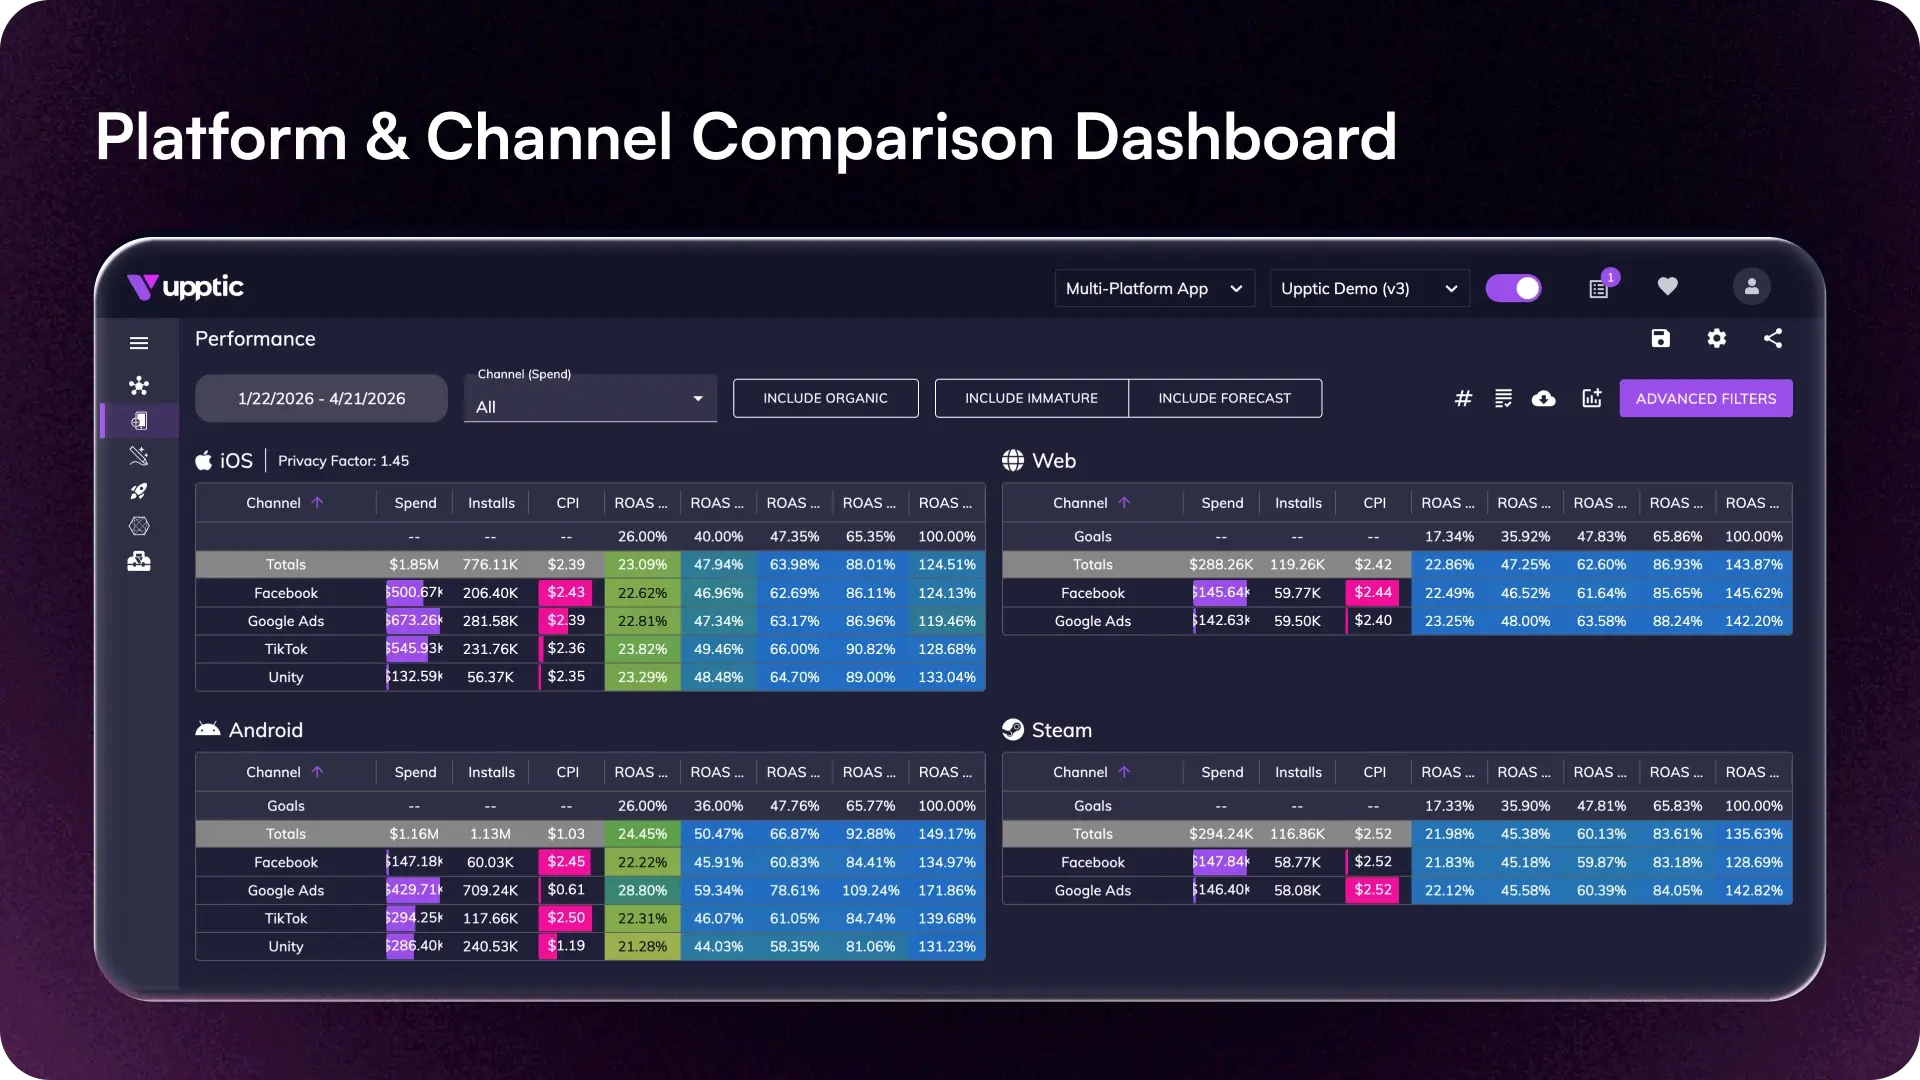
Creative performance typically needs a unique subset of analytic tools since they typically think about assets at the concept, not the ad unit level. A single concept can run across dozens of ad variants with different names across networks, so concept-level winners get fragmented into unrelated rows. If your dashboard can’t reconcile that, your team may be iterating on the wrong ideas.Your dashboard should drill from network to campaign to ad to creative concept, so weak spots are caught before they waste budget.
If your team can’t see channel-level ROAS in a format they trust, your UA program is a gamble.
How Predictive Analytics Forecasts UA Performance with Incomplete Data
Cohort revenue matures slowly. UA decisions do not.
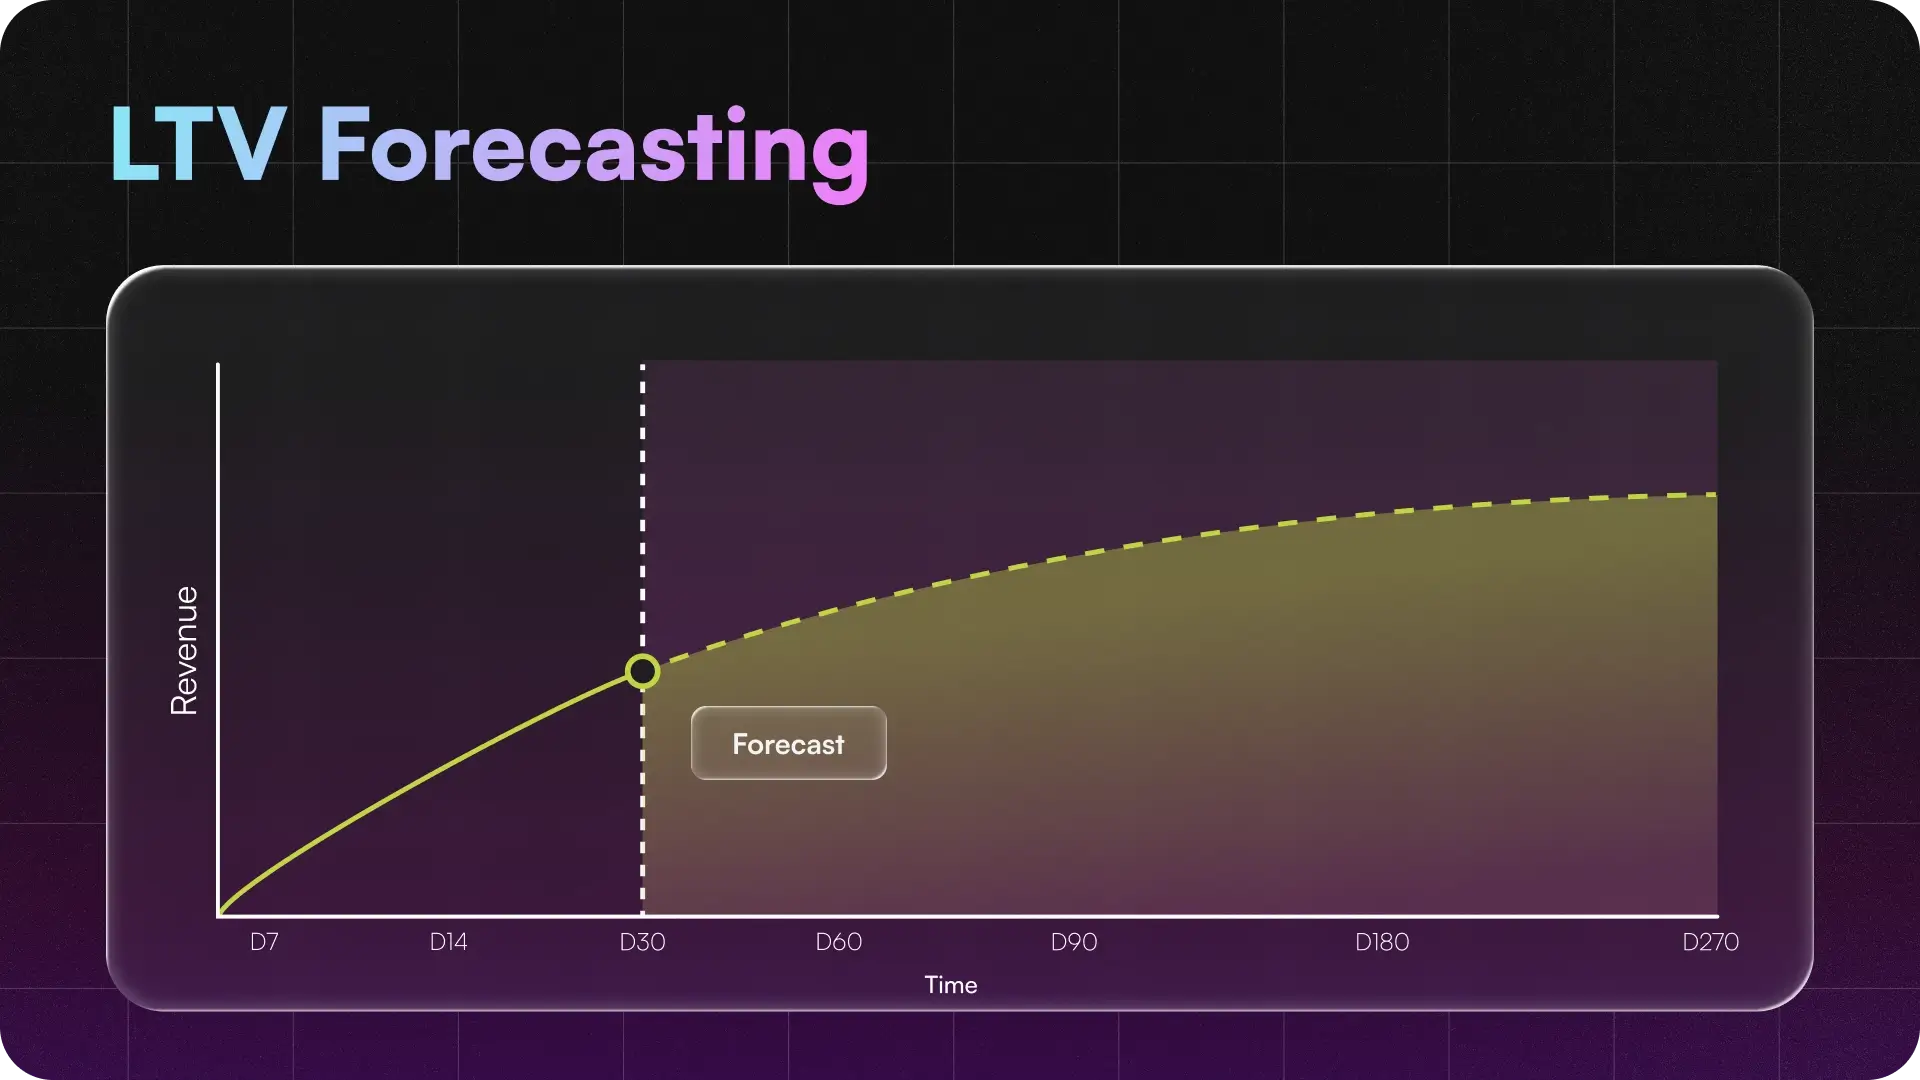
A forecasting model uses early cohort data and your ARPU curve to estimate where performance is headed at D30, D90, and beyond. Data from your first week of revenue becomes a buying signal, so you can scale, hold, or cut campaigns before the payback window closes.
On iOS, forecasts also need to account for missing attribution, so early cohort signals are not interpreted in isolation.
Research and Validate Your UA Buying Targets
Before you trust a buying target, validate the data behind it.
Make certain you audit your core performance dataset, slice revenue by cohort and channel, and reconcile SKAN with your MMP. If you skip any of these steps, your budget will likely go to the wrong place.
Audit the measurement itself
MMP setup errors, mis-attributed conversion events, and broken SDK integrations wreck data, and they often get misread as bad campaign performance.
Account for organic uplift
Buying targets should reflect the full impact of paid spend. Organic uplift accounts for installs that show up as “organic” but were actually influenced by paid campaigns. Without that adjustment, paid channels can look weaker than they really are, which distorts your buying targets.
Root out fraud aggressively
Watch for flat monetization, irregular retention curves, and results that look too good to be true. Start with trusted networks, use your MMP’s fraud detection, and audit suspicious cohorts one at a time instead of in aggregate.
Use MMM for incrementality, not daily UA optimization
Media mix modeling (MMM) can help answer big-picture questions: whether total marketing spend is creating incremental growth, how channels interact over longer windows, and whether paid media is lifting organic demand.
However, MMM is the wrong primary tool for day-to-day mobile game UA decisions. It was built for macro budget allocation over weeks or months, not campaign, cohort, and creative-level optimization.
For performance marketing, use cohort-level attribution, SKAN modeling, and payback-based buying targets as your operating layer. Use MMM as a secondary lens when you need to validate incrementality across longer time horizons.
Track UA Spend and Budgets
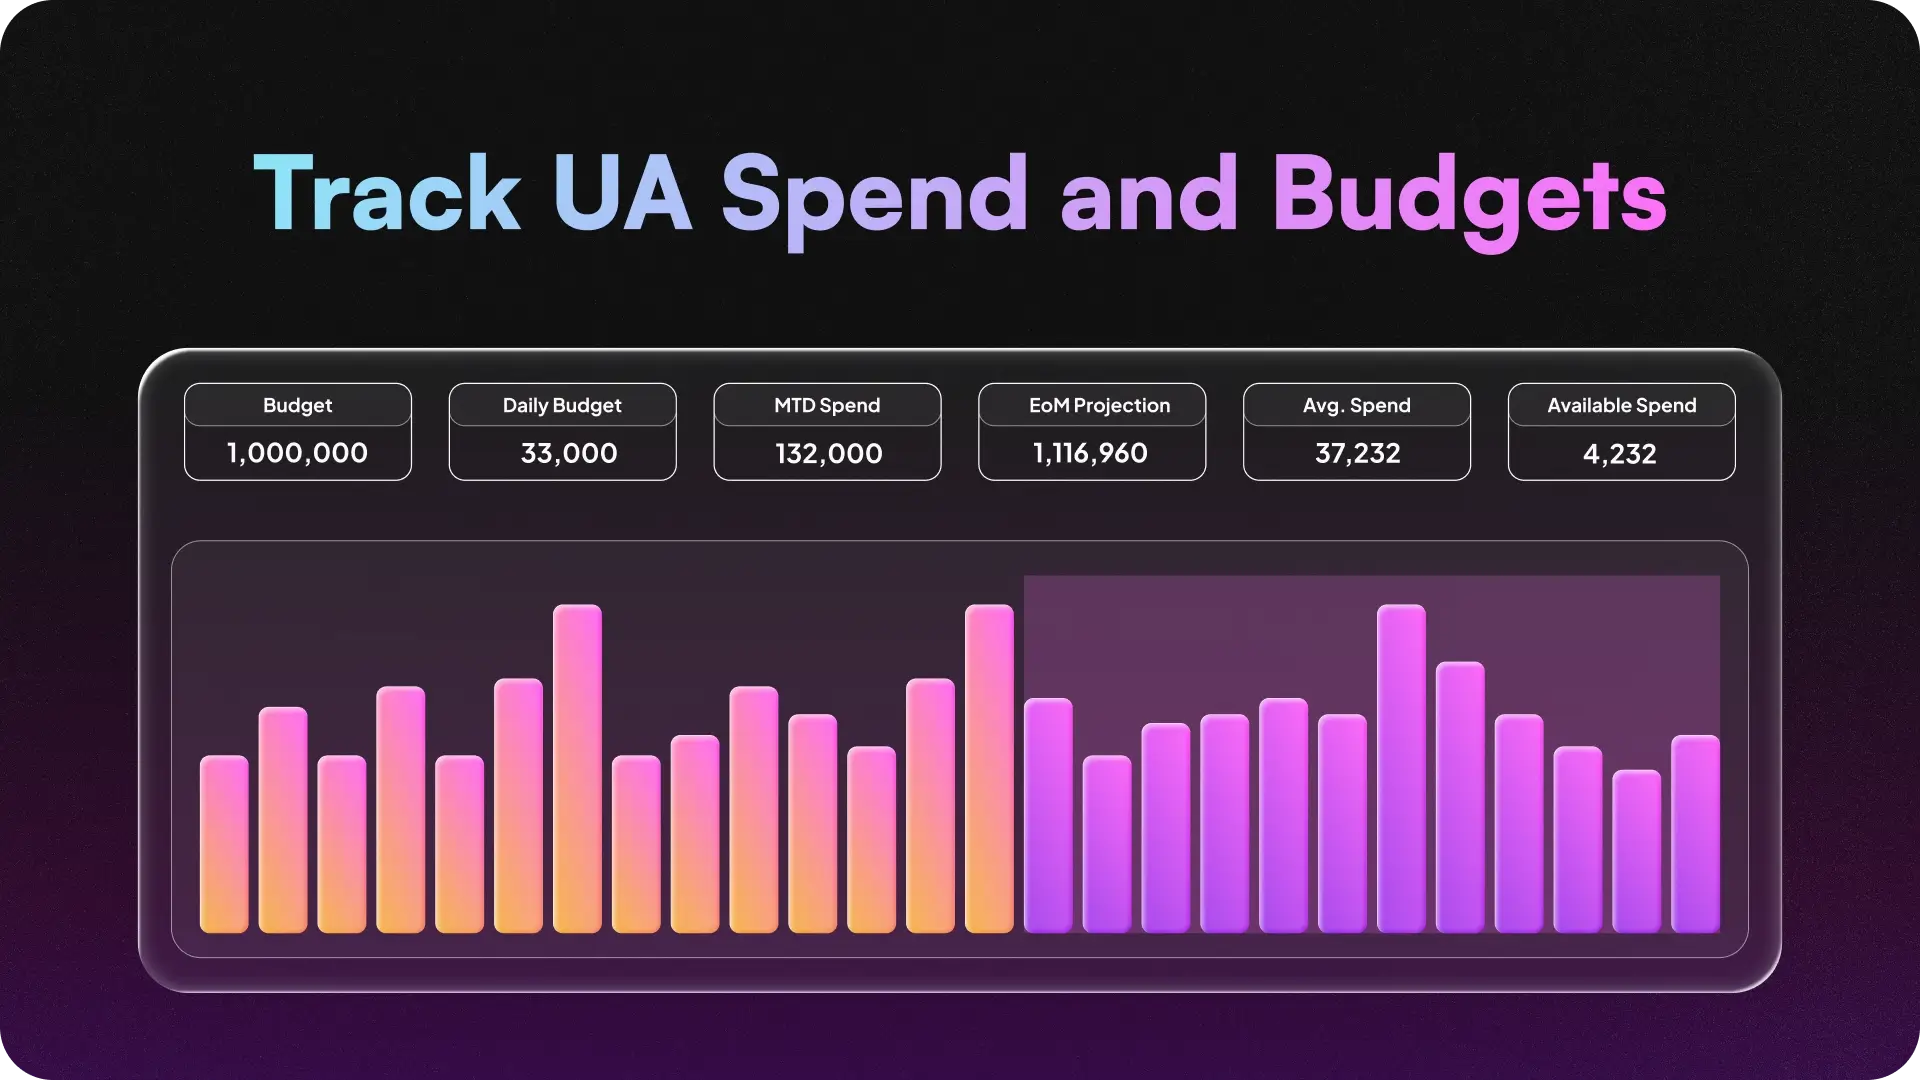
Every UA lead has been in the meeting where finance asks why last month’s spend ran over, but the answer is buried across any number of sources and dashboards.
Spend tracking should show current spend, forecasted month-end spend, and historical spend by channel, game, campaign, and market. That gives UA and finance the same answer when budgets shift or questions come up.
Spend reporting also needs to account for network credits. If credits are not applied correctly, net spend will be wrong and budget pacing will drift. Track credits alongside monthly budgets so finance and UA are working from the same spend number.
Build vs. Buy Game Marketing Analytics
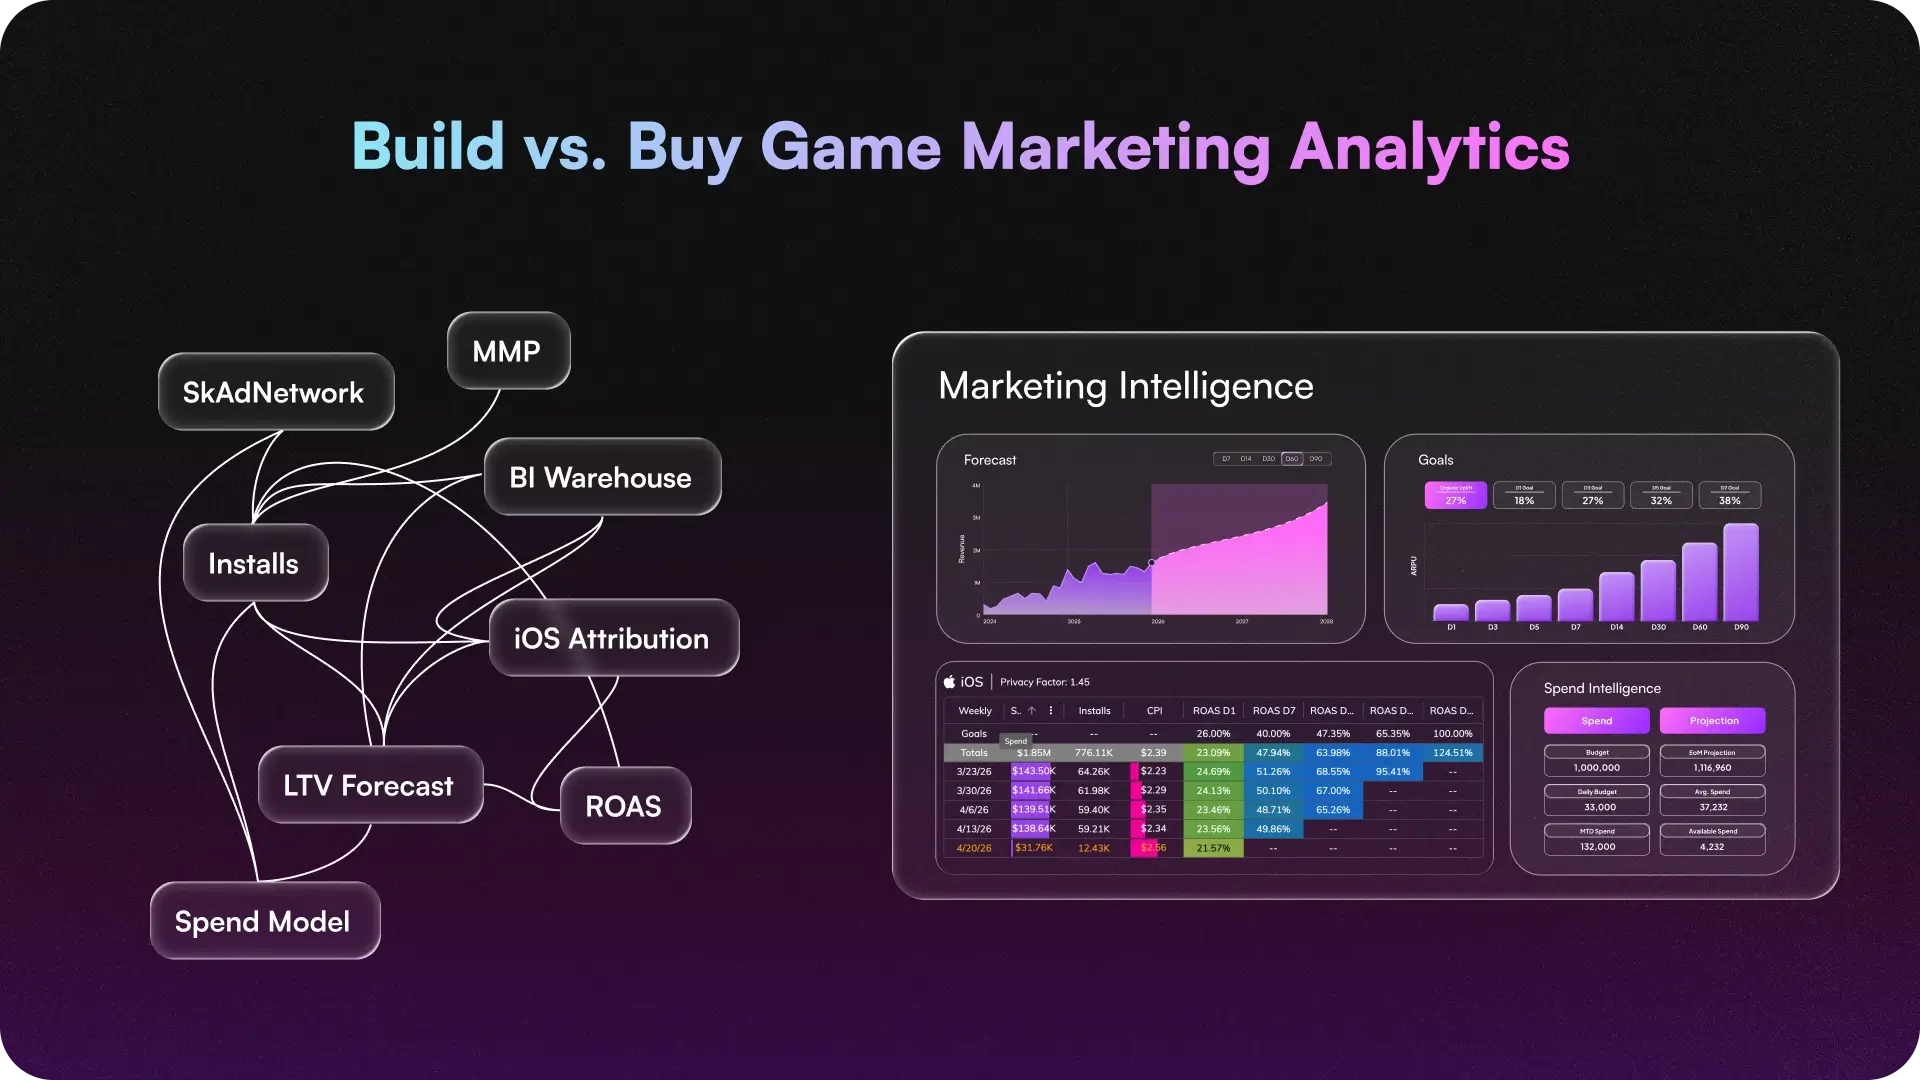
Building marketing analytics in-house is a major lift.
An in-house build means expensive teams, custom data lakes, visualization tools, and months of setup. The cost can quickly reach seven figures.
That’s why most teams should leverage existing analytics infrastructure instead. The Upptic Game Growth Engine is tested at scale by leading game companies, so you can skip the dashboard build and focus on scaling your game.
Ready to run profitable UA without duct taping dashboards together? Talk to our team.